
Productionalize Machine Learning Models for HVAC Industry using MLOps
Challenge A company in the global HVAC (heating, ventilation, and air conditioning) industry, serving tens of thousands of customers worldwide,…
Read more
The Federal Public Service for Mobility and Transport is responsible for preparing, implementing, and supporting mobility and transport policy.
Electric vehicles, rising prices of ownership, and an increasing number of cars are reshaping the Belgian mobility landscape. This landscape is evolving constantly and is the result of a complex interplay of different trends and evolutions. The FPS Mobility and Transport aims to inform the general public about the key trends and development in the most clear and compelling way.
FPS Mobility and Transport approached Movias and Algorhythm to present this complex story in the most distinctive, compelling and enticing manner possible to the Belgian public.
We use storytelling to decompose this complex topic into bitesize pieces. Guiding the public through this story makes it understandable for the broad public – from those learning about the topic to those managing the future of mobility. By doing this, we combine storytelling and data visualization best practices to inform and shape the public debate.
Power BI was used to bring this story towards the public, embedded in a web interface. By doing this we were able to make clear and attractive visualizations which are interactive. This way, the reader can take control of the story to guide him/her towards the most interesting insights.
The website focuses on the key changes in mobility, divided into four themes:
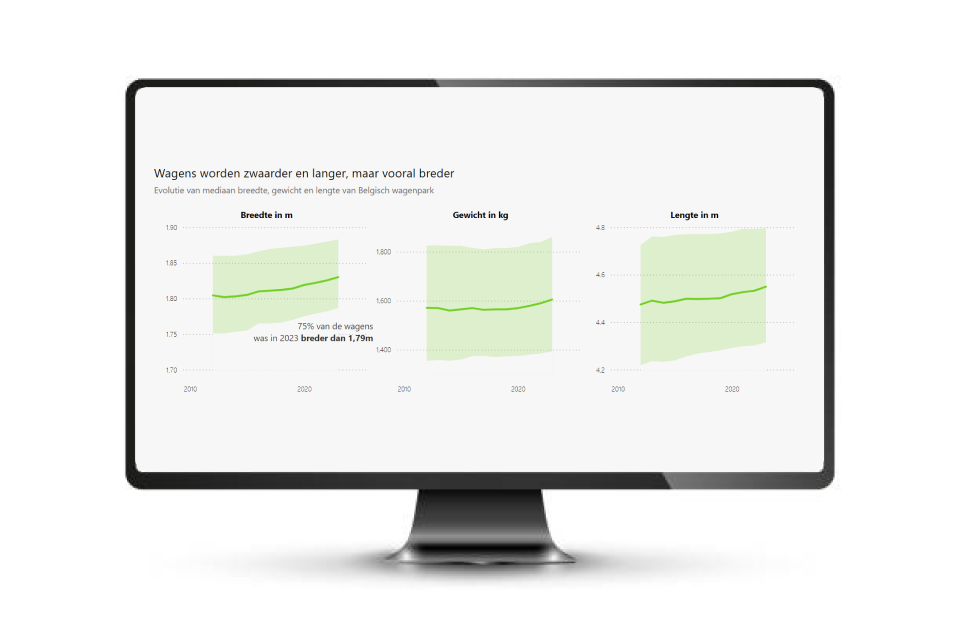
The vehicle fleet is expanding, not only in the number of cars but also in their size.
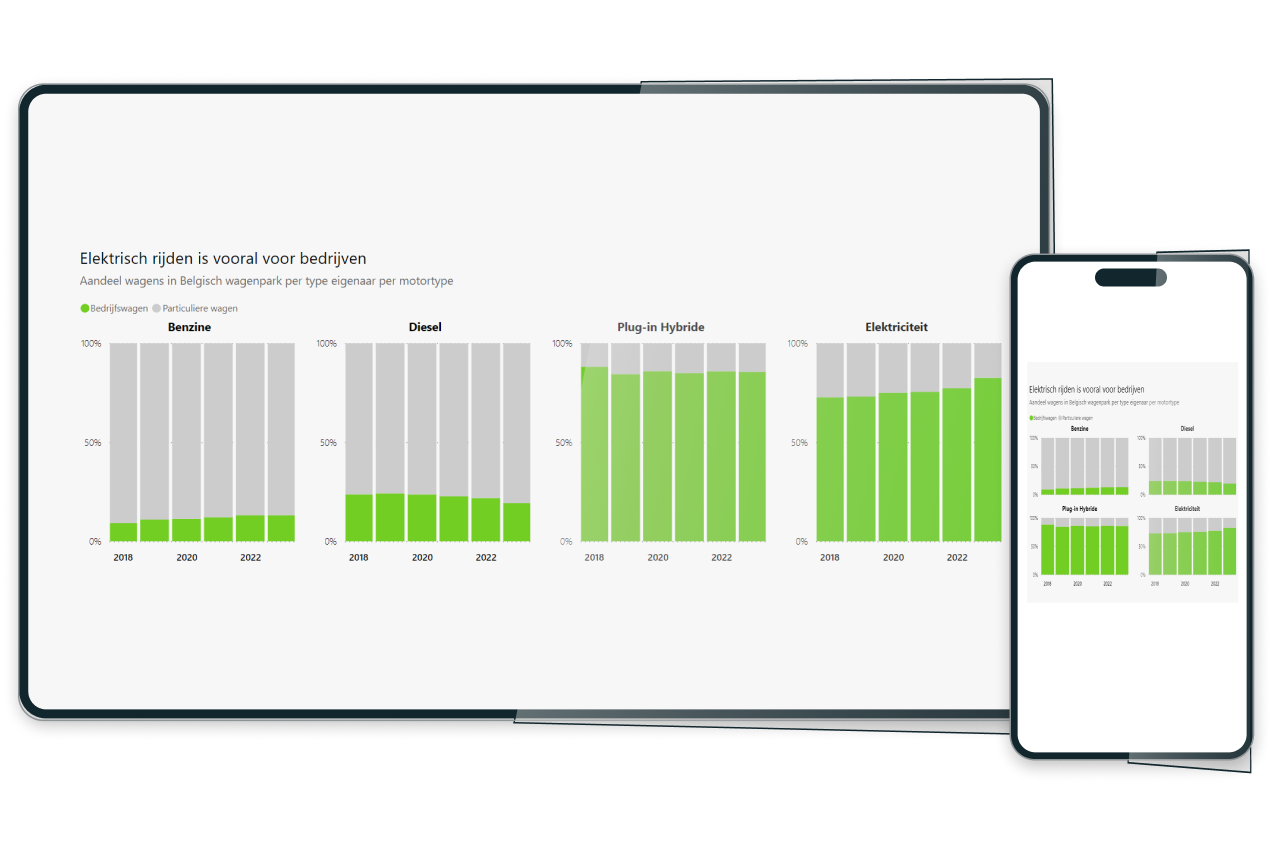
The number of electric and hybrid vehicles is significantly higher among company cars than among private vehicles.
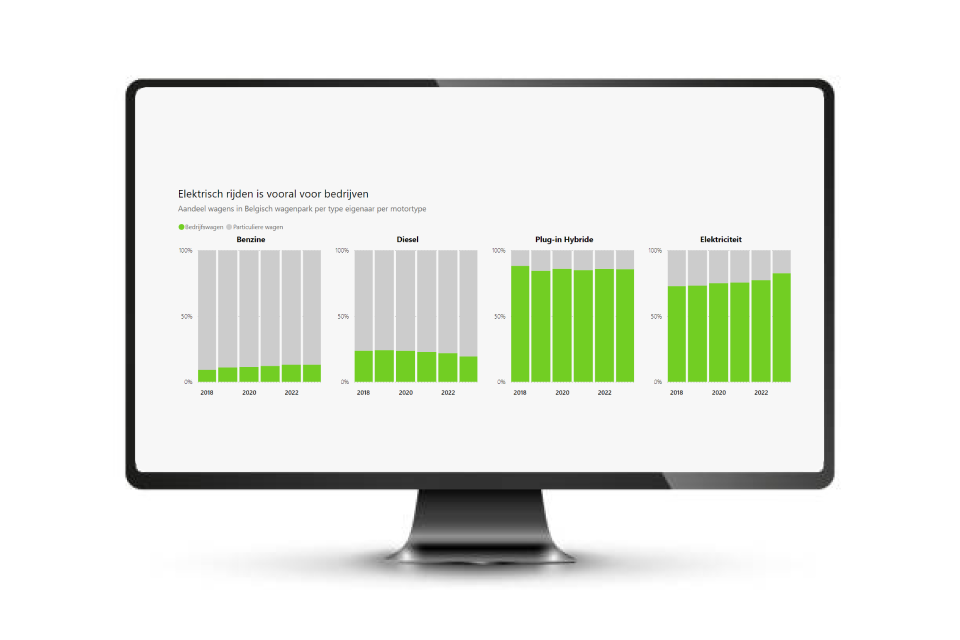
Location and infrastructure are important factors in enabling the shift to electric driving.
A limited supply of small electric cars keeps the cost in the smaller category of vehicles higher than that of gasoline cars.

From raw data to data driven storytelling
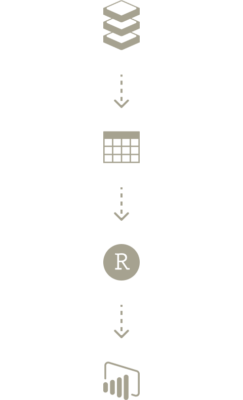
Gathering
Collecting and processing the available data sources into a manageable dataset by our partners at Movias. For this project, the complete Vehicle Registration Service (DIV) database was made available for this analysis.
Exploration
Using R to analyze and explore the available data in order to define interesting trends and translate them into the appropriate visualizations.
Visualization
Translating our insights into the Power BI report that will be embedded in the final webpage.
Refinements
We defined the core narrative based on the initial conclusions from the data analysis, refining it further through monthly feedback sessions with FPS Mobility and Transport.
This process allowed us to test various data visualizations for the report and gather valuable user insights.
Technical challenges
Our primary goal was to achieve a seamless integration and embedding of the final Power BI report into the client’s website.
We developed multiple versions of the report, each tailored to specific screen sizes, ensuring a responsive design for an optimal user experience across all devices.
The general content page structure consists of four parts:
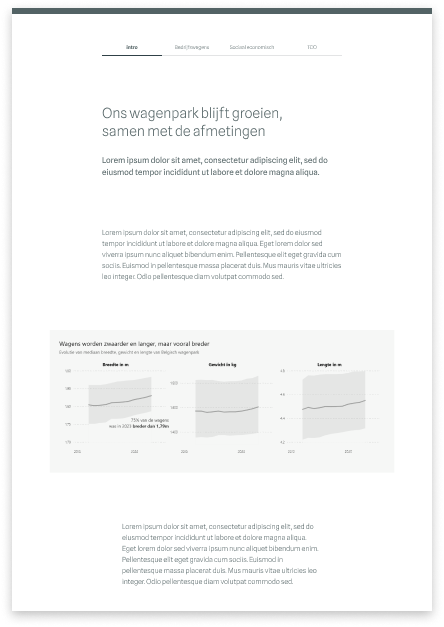
Navigation
Navigate through the different themes of the report.
Introduction
Introduction to the topic and the main conclusion.
Data visualisation
Large-scale data visualizations to highlight key trends.
Text
Text between the graphs weaves the story into a cohesive whole.
Let the user interact with the graphs in a new way through data driven storytelling with Power BI
Annotate specific period in your data

Navigate through the story of the graph
Responsively designed PowerBI dashboard for optimal user experience
The editorial data visualization is a showcase for an interactive experience that combines journalism, data visualization, storytelling and user experience into a holistic concept.
This type of storytelling is useful to communicate complex phenomena towards a large audience. It furthermore allows for a personalized feeling by adding interactivity and possibilities for the user to alter the storyline. It is very suitable for corporate communications, marketing storytelling, yearly reports, whitepapers, communication towards the general public and many more use cases.
Let’s Get In Touch
About This Case
Delen